
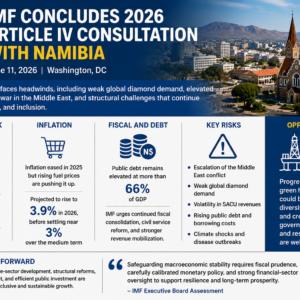


- Despite higher energy prices and lower tourism arrivals, Cyprus’s economy remains resilient, with strong growth and fundamentals.
- Strong fiscal performance and falling public debt create room for a gradual and growth-friendly fiscal easing—focused on high-quality investment and efficiency gains. Financial sector soundness should be preserved and credit deepening supported.
- Sustaining strong growth requires reforms to boost productivity and investment, including through a more efficient judiciary, a better‑skilled workforce, wider use of digital technologies, and progress on energy sector reforms.
Washington, DC: On June 17, 2026, the Executive Board on of the International Monetary Fund (IMF) completed the Article IV Consultation for Cyprus.[1] The authorities have consented to the publication of the Staff Report prepared for this consultation.[2]
Cyprus’s economy continues to perform strongly, with 2025 growth among the highest in the EU, supported by robust domestic demand and strong services exports, particularly ICT and tourism. Inflation declined last year, reflecting favorable energy and goods price developments, but has started to pick up as higher energy prices linked to the war in the Middle East feed through. Tourism is also showing signs of softening. Fiscal performance has remained strong, with continued surpluses and public debt declining below 60 percent of GDP. The financial sector is sound, with strong capital and liquidity buffers and improving asset quality.
Growth is expected to moderate this year as higher energy prices and geopolitical tensions weigh on real incomes, tourism, and confidence. Inflation is projected to rise in the near term before easing. Risks are tilted to the downside, notably from a more prolonged war in the Middle East, tighter global financial conditions, and weaker external demand. Medium-term prospects are more balanced supported by strong fundamentals and reform momentum.
Executive Board Assessment[3]
Executive Directors commended Cyprus’s continued strong macroeconomic performance and resilience, with sustained growth, fiscal surpluses, and declining public debt despite a challenging external environment. Directors cautioned however that near‑term risks are tilted to the downside—including from geopolitical tensions and higher energy prices—and that structural vulnerabilities persist. They encouraged the authorities to preserve fiscal sustainability and to press ahead with structural reforms to boost productivity and support long‑term growth.
Directors commended the authorities’ strong fiscal performance, which has rebuilt buffers and put public debt on a firm downward path. They agreed that, as policy space expands, any fiscal easing should be gradual and well‑calibrated to avoid overheating, while preserving buffers for rising spending pressures related to ageing, defense, and infrastructure needs. Directors stressed the importance of improving the efficiency of spending and taxation, prioritizing high‑quality public investment and maintaining discipline in public wage growth. Measures to support households should be temporary and well targeted. Directors welcomed the recent comprehensive tax reform and the proposal to build financial assets in the social security fund.
Directors agreed that the banking sector remains sound, supported by strong capital and liquidity buffers and improving asset quality. At the same time, they considered that significant exposure to real estate and remaining legacy NPLs outside the banking sector warrant continued vigilance. Noting that credit intermediation remains subdued, Directors stressed the need to preserve an effective foreclosure framework, strengthen insolvency processes, and improve judicial efficiency to support the resolution of distressed assets, deepen credit markets, and foster investment. They also emphasized the importance of strengthening risk monitoring frameworks and advancing AML/CFT supervision.
Directors concurred that continued implementation of structural reforms is key to raising productivity and supporting long‑term growth. Priorities include addressing skills mismatches, strengthening human capital and AI readiness, improving the business environment, and enhancing judicial efficiency. Directors stressed that advancing energy sector reform is critical to reducing costs, strengthening energy security, and supporting the green transition. Timely implementation of measures under the EU‑funded Recovery and Resilience Facility would also be important.
| Table 1. Cyprus: Selected Economic Indicators, 2022–2031 | ||||||||||
| 2022 | 2023 | 2024 | 2025 | 2026 | 2027 | 2028 | 2029 | 2030 | 2031 | |
| Projections | ||||||||||
| Real Economy | (Percent change, unless otherwise indicated) | |||||||||
| Real GDP | 8.7 | 3.6 | 3.9 | 3.8 | 2.6 | 3.0 | 3.0 | 3.0 | 3.0 | 3.0 |
| Domestic demand | 8.8 | 6.6 | 2.9 | 1.4 | 4.4 | 3.5 | 3.3 | 3.0 | 2.8 | 2.8 |
| Consumption | 8.1 | 5.2 | 3.4 | 3.0 | 2.7 | 2.6 | 2.7 | 2.8 | 2.8 | 2.2 |
| Private consumption | 8.9 | 6.0 | 4.0 | 3.3 | 2.9 | 2.5 | 3.0 | 3.0 | 3.0 | 3.0 |
| Public consumption | 5.5 | 2.9 | 1.6 | 2.0 | 1.7 | 2.7 | 1.6 | 1.9 | 2.2 | 2.5 |
| Gross capital formation | 11.5 | 12.0 | 0.8 | -4.6 | 11.2 | 6.9 | 5.5 | 4.0 | 2.5 | 2.5 |
| Foreign balance 1/ | 0.2 | -2.9 | 1.2 | 2.6 | -1.6 | -0.4 | -0.3 | 0.0 | 0.3 | 0.3 |
| Exports of goods and services | 27.8 | -1.6 | 5.7 | 5.0 | 3.3 | 5.5 | 4.1 | 4.1 | 4.0 | 4.0 |
| Imports of goods and services | 28.8 | 1.2 | 4.6 | 2.5 | 5.0 | 6.1 | 4.4 | 4.1 | 3.9 | 4.0 |
| Potential GDP growth | 6.7 | 4.8 | 3.7 | 3.6 | 3.4 | 3.2 | 3.0 | 3.0 | 3.0 | 3.0 |
| Output gap (percent of potential GDP) | 1.7 | 0.6 | 0.8 | 1.0 | 0.1 | 0.0 | 0.0 | 0.0 | 0.0 | 0.0 |
| HICP (period average, seasonally-adjusted) | 8.1 | 3.9 | 2.3 | 0.8 | 3.5 | 1.5 | 2.0 | 2.0 | 2.0 | 2.0 |
| HICP (end of period, seasonally-adjusted) | 7.6 | 1.9 | 3.1 | 0.1 | 3.2 | 2.0 | 2.0 | 2.0 | 2.0 | 2.0 |
| GDP deflator | 6.2 | 5.6 | 3.1 | 1.1 | 4.0 | 1.9 | 2.2 | 2.3 | 2.2 | 2.2 |
| Unemployment rate (percent, period average) | 6.2 | 5.7 | 4.8 | 4.4 | 4.6 | 4.7 | 4.7 | 4.7 | 4.7 | 4.7 |
| Employment growth (percent, period average) | 5.0 | 2.8 | 1.5 | 3.6 | 0.7 | 0.8 | 0.8 | 0.8 | 0.8 | 0.8 |
| Labor force | 4.0 | 2.3 | 0.4 | 3.1 | 1.0 | 0.9 | 0.8 | 0.8 | 0.8 | 0.8 |
| Public Finance | (Percent of GDP, unless otherwise indicated) | |||||||||
| General government balance | 2.7 | 1.7 | 4.1 | 3.4 | 2.3 | 2.6 | 2.5 | 2.4 | 2.2 | 2.0 |
| Revenue | 40.4 | 42.3 | 42.4 | 43.6 | 42.3 | 41.8 | 41.3 | 40.8 | 40.7 | 40.5 |
| Expenditure | 37.7 | 40.6 | 38.3 | 40.2 | 40.0 | 39.2 | 38.8 | 38.4 | 38.4 | 38.5 |
| Primary Fiscal Balance | 4.0 | 2.9 | 5.4 | 4.5 | 3.5 | 3.7 | 3.6 | 3.4 | 3.3 | 3.1 |
| General government debt | 80.3 | 71.1 | 62.8 | 55.0 | 50.5 | 46.2 | 42.2 | 38.4 | 35.5 | 32.4 |
| Balance of Payments | ||||||||||
| Current account balance | -6.9 | -9.7 | -8.2 | -6.4 | -8.2 | -8.3 | -8.6 | -8.7 | -8.5 | -8.4 |
| Trade Balance (goods and services) | 3.6 | 2.0 | 3.6 | 5.7 | 4.6 | 4.2 | 3.9 | 4.0 | 4.2 | 4.4 |
| Exports of goods and services | 104.7 | 96.4 | 97.0 | 97.6 | 97.7 | 99.6 | 100.4 | 101.0 | 101.8 | 102.5 |
| Imports of goods and services | 101.1 | 94.4 | 93.4 | 91.9 | 93.1 | 95.5 | 96.5 | 97.0 | 97.6 | 98.1 |
| Goods balance | -19.5 | -22.7 | -19.9 | -19.4 | -20.9 | -21.8 | -22.1 | -22.2 | -22.3 | -22.3 |
| Services balance | 23.1 | 24.8 | 23.5 | 25.1 | 25.5 | 25.9 | 26.0 | 26.2 | 26.4 | 26.7 |
| Primary income, net | -9.6 | -10.5 | -10.8 | -11.1 | -11.8 | -11.3 | -11.3 | -11.5 | -11.5 | -11.6 |
| Secondary income, net | -0.9 | -1.3 | -1.0 | -0.9 | -1.0 | -1.1 | -1.2 | -1.2 | -1.2 | -1.3 |
| Capital account, net | 0.1 | 0.1 | -0.6 | -0.2 | 0.2 | 0.1 | 0.1 | 0.1 | 0.1 | 0.1 |
| Financial account, net | -4.4 | -7.6 | -7.8 | -6.4 | -8.1 | -8.2 | -8.5 | -8.6 | -8.5 | -8.4 |
| Direct investment | -17.9 | -31.9 | -14.7 | -23.3 | -15.3 | -15.8 | -16.3 | -16.5 | -16.7 | -16.7 |
| Portfolio investment | 14.3 | 11.3 | 13.6 | 8.7 | 13.5 | 14.1 | 14.3 | 14.7 | 14.8 | 14.9 |
| Other investment and financial derivatives | -1.1 | 13.1 | -6.9 | 8.1 | -6.2 | -6.5 | -6.5 | -6.8 | -6.6 | -6.5 |
| Reserves ( + accumulation) | 0.3 | 0.0 | 0.2 | 0.1 | 0.0 | 0.0 | 0.0 | 0.0 | 0.0 | 0.0 |
| Program financing 2/ | 0.0 | 0.0 | 0.0 | -1.0 | -2.6 | -2.5 | -2.3 | -2.3 | -1.9 | -2.0 |
| Errors and omissions | 2.4 | 2.1 | 1.0 | 0.2 | 0.0 | 0.0 | 0.0 | 0.0 | 0.0 | 0.0 |
| Saving-Investment Balance | ||||||||||
| National saving | 13.5 | 12.2 | 12.3 | 13.6 | 12.6 | 13.3 | 13.5 | 13.5 | 13.5 | 13.5 |
| Government | 5.8 | 6.6 | 7.6 | 8.3 | 7.0 | 6.7 | 6.3 | 5.9 | 5.6 | 5.4 |
| Non-government | 7.7 | 5.7 | 4.7 | 5.3 | 5.6 | 6.6 | 7.2 | 7.6 | 7.9 | 8.1 |
| Gross capital formation | 20.4 | 22.0 | 20.5 | 20.0 | 20.9 | 21.6 | 22.1 | 22.2 | 22.1 | 21.9 |
| Government | 3.1 | 4.9 | 3.5 | 4.9 | 4.7 | 4.1 | 3.8 | 3.5 | 3.4 | 3.4 |
| Private | 17.2 | 17.1 | 17.1 | 15.2 | 16.2 | 17.5 | 18.3 | 18.7 | 18.7 | 18.6 |
| Foreign saving | -6.9 | -9.7 | -8.2 | -6.4 | -8.2 | -8.3 | -8.6 | -8.7 | -8.5 | -8.4 |
| Memorandum Item: | ||||||||||
| Nominal GDP (billions of euros) | 29.6 | 32.4 | 34.8 | 36.5 | 38.9 | 40.8 | 43.0 | 45.3 | 47.6 | 50.1 |
| Structural primary balance | 3.4 | 2.5 | 5.1 | 4.2 | 3.5 | 3.7 | 3.6 | 3.4 | 3.3 | 3.1 |
| External debt | 868.1 | 744.6 | 674.1 | 639.5 | 599.0 | 564.4 | 529.8 | 498.6 | 468.2 | 440.1 |
| Net IIP | -97.4 | -92.4 | -84.1 | -80.8 | -83.9 | -88.1 | -92.3 | -96.2 | -99.9 | -103.3 |
| APSP oil price ($ per barrel) 3/ | 96.4 | 80.6 | 79.2 | 67.7 | 99.4 | 74.6 | 74.2 | 73.9 | 73.7 | 73.3 |
| Sources: Cystat, Eurostat, Central Bank of Cyprus, and IMF staff estimates. | ||||||||||
| 1/ Contribution to real GDP growth | ||||||||||
| 2/ Program financing (+ purchases, – repurchases) is included under the Financial Account, with consistent sign conversion | ||||||||||
| 3/ Average of UK Brent, Dubai Fateh, and West Texas Intermediate crude oil prices based on the Adverse Scenario assumptions from April 2026 World Economic Outlook | ||||||||||
[1] Under Article IV of the IMF’s Articles of Agreement, the IMF holds bilateral discussions with members, usually every year. A staff team visits the country, collects economic and financial information, and discusses with officials the country’s economic developments and policies. On return to headquarters, the staff prepares a report, which forms the basis for discussion by the Executive Board.
[2] Under the IMF’s Articles of Agreement, publication of documents that pertain to member countries is voluntary and requires the member consent. The staff report will be shortly published on the www.imf.org/cyprus page.
[3] At the conclusion of the discussion, the Managing Director, as Chairman of the Board, summarizes the views of Executive Directors, and this summary is transmitted to the country’s authorities. An explanation of any qualifiers used in summings up can be found here: http://www.IMF.org/external/np/sec/misc/qualifiers.htm.


More Stories
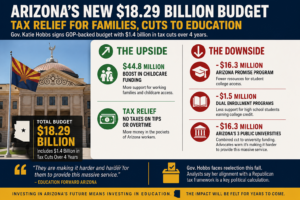
Arizona Budget Delivers $1.4 Billion Tax Cut, But Education Programs Face Significant Cuts
A Message from USBC President & CEO in Observance of Juneteenth
IMF Staff Concludes Visit to Kazakhstan